
The home page of your Technis account helps you get a quick overview of key metrics from your sites as well as identify any opportunities to leverage.
Here's how you can personalize the layout and the contents of the home page:
1. Login to your account.
2. Click Customize in top-right corner of the page.
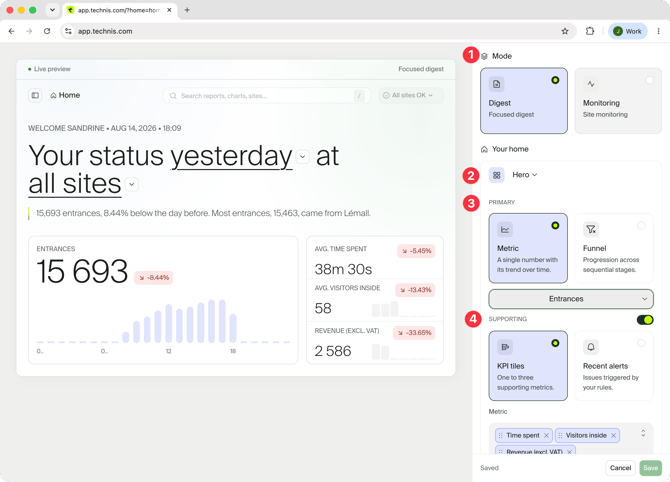
From here you can choose between two layouts, Digest or Monitoring. Based on the selected layout, different options will be revealed below.
Digest
Default layout displaying up to 4 key metrics or one metric with recent alert list. Metrics can be displayed as column charts, or as a funnel.
Together with your selected metrics, you can quickly switch between different time frames and sites, access your pinned reports and see weekly insights.
Insights
Every Monday, Insights are delivered to your homepage with observations made over past week across your sites.
There are two types of insights:
- Leverage: we've identified a positive trend on a site last week that you can use and replicate on other sites. For example: more than average number of visitors, or more purchases while customers stay less time.
- Investigate: we've identified a negative trend that may need an investigation to correct-course. For example: devices disconnected for longer period of time, or revenue dropping.
Insights are automatically enabled for our retail customers with at least two stores in their organization and at least 6 weeks of historical data.
Monitoring
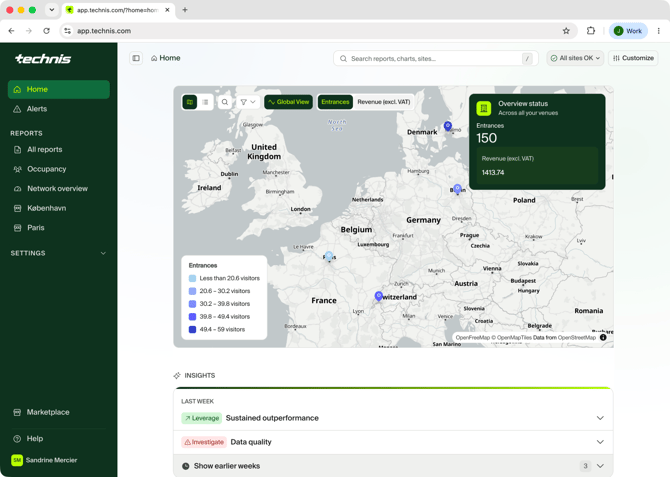
The monitoring layout allows you to visualize your whole portfolio of sites in a map with selected metrics overlayed.
See how to configure a multisite map or a floor plan.