Funnel chart
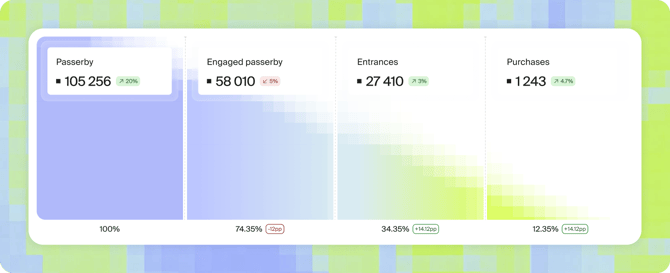
With funnel chart you can visualize the flow of people through your space and business. It's especially great for visualizing full sales funnel and visitor journey, from street to checkout.
Multisite map
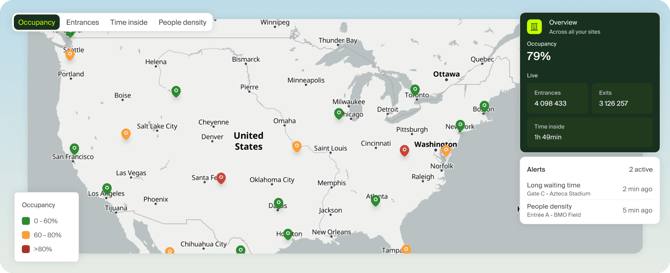
Visualise your entire portfolio of sites on a single map to identify sites that need attention. The map is perfect for large displays as a monitoring dashboard on large-scale events.
Other improvements
-
Reports: Scatter plot visualization helps you find correlation in your energy usage across your portfolio. Energy label which helps you visualize the conformity of your assets.
-
API: We're introducing a new, modern, REST API to help you build custom applications on top of Technis' data.
- Performance improvement on report loading, with up to 5x faster loads on complex reports.