Reports overview
A report is the basic unit of performing data analysis in Technis. This article focuses on common concepts across reports.
Types of reports
There are two types of reports available in the platform:
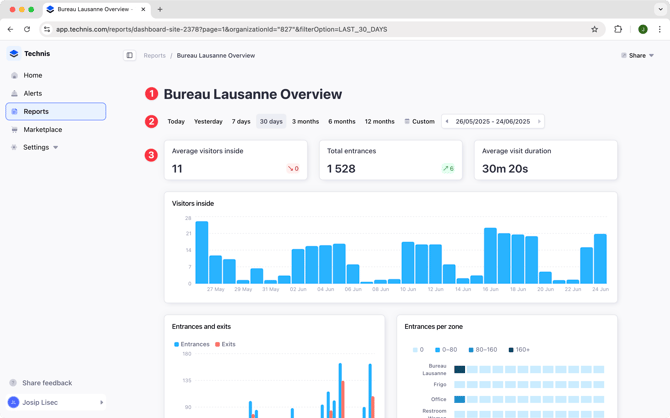
- Pre-built reports: for each site of your organization we create an overview report which shows all the essential metrics. These reports cannot be modified.
- Custom reports: these reports are created by the team members of you organization and can be modified.
Report components
A report consists of different charts, text and filtering controls.

- Metadata: the name of the report, author and last time the report itself was modified.
- Time filters: with time filters you control the time range for which the data is displayed in all the report’s charts.
- Charts: charts, tables and other visualizations that display data from connected sensors.
- Text: in a custom report, you can add rich text to add commentary and context, create sections or link to other reports.
Visibility
Within your organization, the rules are as follows:
- Pre-built reports: users with access to the site have the access to the report.
- Custom reports: all reports are visible to all users. If a chart in the report references data from a site they don’t have access to, that chart will not display any data.
Data freshness
All data on reports is automatically updated once a minute.
Temporality
In a report, each chart can display its own time range. The time selector a the top of the report allows you to temporarily enforce the same time frame for all charts.
Available time ranges are:
- Auto: Available only on custom report. When selected, each chart uses it's own time frame. This is the default behavior.
- Today, Yesterday, Last N: Displaying data relative to current time. For example, Last 30 days option will display data for last 30 days when selected.
- Custom: Any fixed time range, for example if selecting January 1 - 15, data for the selected period will be displayed no matter when looking at the report.
Time grain
Sometimes also referred to as time granularity, defines the lowest time unit at which the data is aggregated and is displayed. For example, with a minutely time grain, data will be displayed in 1 minute intervals, even if changes are captured by Technis in-real time.
Breakdowns
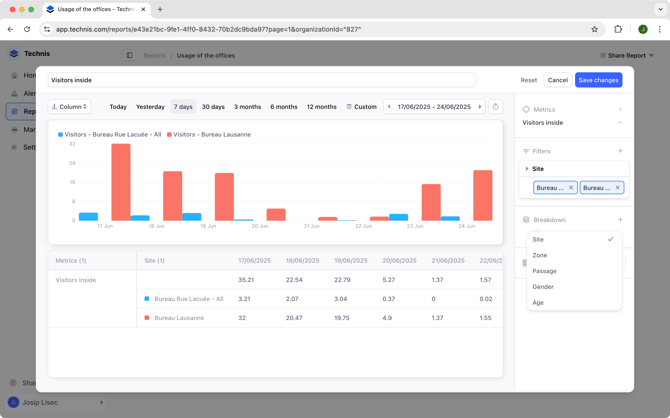
Breakdown groups the results of your queries by a property, allowing you to examine impact of each property individually.
This feature is useful for comparing results between multiple sites, zones or passages.

Entity aggregation
Entity aggregation controls how data from multiple entities, such as sites or zones, are aggregated together. By default system decides the most appropriate method but you can tailor it to your need.
For example, when looking at "visitors inside" of two sites, by default the system displays an average of the two sites. With entity aggregation, you can choose to see a sum instead, displaying total number of visitors inside of both sites.